Are the Sydney Opera House shells really cut from one sphere? I checked with LiDAR
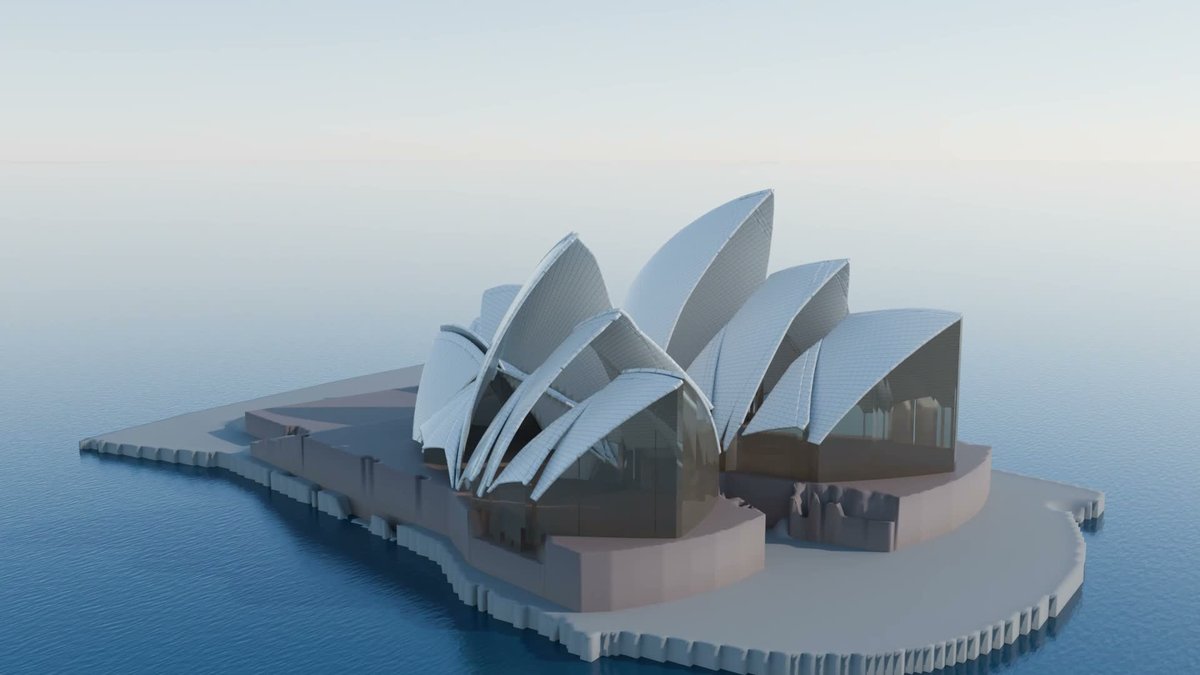
The Sydney Opera House is famous for a geometry trick. Jørn Utzon's team spent years trying to find a way to build the roof, and the answer, usually called the spherical solution, was to make every shell a piece cut from the surface of one sphere, about 75 m in radius. That way the curved ribs and tiles could be cast from the same moulds. I wanted to rebuild the building for a video, and the trick gave me a question I could actually test: if I trace the roof in FlatCad and fit a sphere to real height data, does the radius come out at 75 m?
Step 1: an outline you can trust
OpenStreetMap has the Opera House mapped in surprising detail: the building outline plus 11 separate roof parts, covering each hall's shells, the maintenance strips between them and the glass roof. I downloaded those through the OpenStreetMap API as raw nodes and ways. Each roof part is a bag of short two- to seven-node ways, so the first job was to chain them into continuous edges that only break where three or more edges meet.
I tried tracing from Google's satellite view first. The shells are up to 67 m tall, and in a satellite image that is not a true orthophoto, they lean away from their footprint, so the traced shells sat metres off the podium. I switched to the Spatial Services NSW aerial imagery, which is a true orthophoto at 0.1 m per pixel. It lined up with the OpenStreetMap edges to about 0.5 m.
Step 2: from map edges to clean CAD lines
A map edge is a chain of points. A CAD drawing wants lines and arcs that you can snap to, mirror and dimension. I fitted each chain with straight lines where it was straight to within 0.25 m, and with three-point arcs where a circle fitted to within 0.25 m. Anything shorter than 1.2 m was dropped as a sliver. The arcs that came out had radii from about 11 m to 106 m.
Two things made the drawing much shorter:
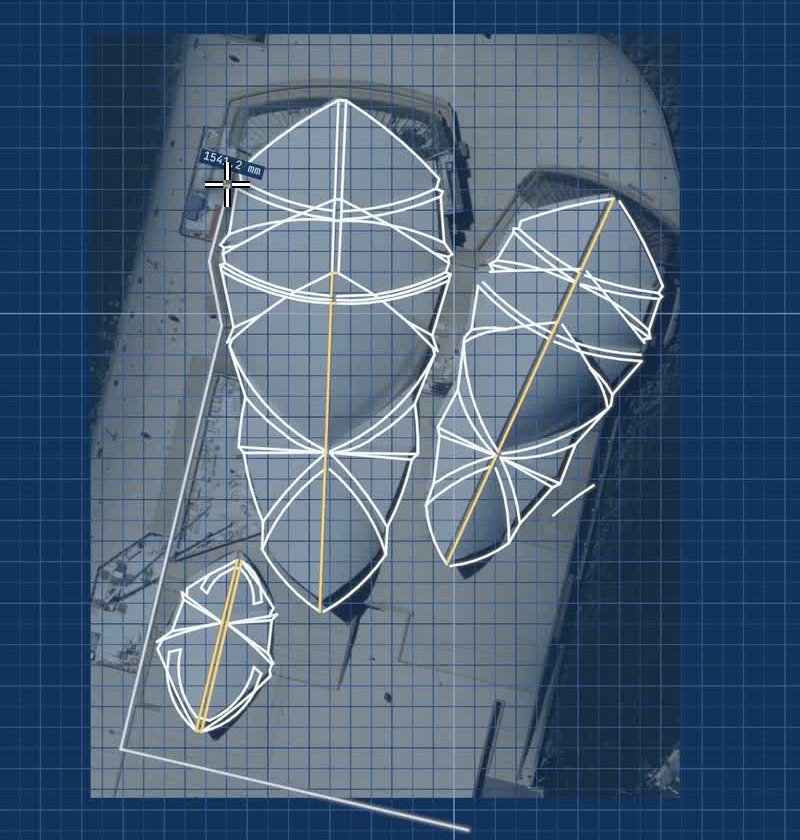
- The halls are mirror-symmetric about their ridge lines, and the map data shows it. So I drew only the left half of each hall and used Mirror for the rest: 61 lines and arcs for the Concert Hall (123.8 m along its ridge), 50 for the Joan Sutherland Theatre (96.9 m) and 56 for the small restaurant shells (42.8 m).
- The order matters with Mirror. My first attempt came out wrong: the selection window used to mirror the theatre also caught 15 pieces of the Concert Hall beside it, and those were flipped across too. Drawing the theatre first, then the Concert Hall, then the restaurant fixed it, together with a check that nothing already drawn sat inside a later mirror window.
The trace was drawn in FlatCad 2D over the aerial photo, in millimetres at 1:1, so one metre on the ground is 1000 units in the file. The length readout in the screenshot below (1542.2 mm) is a segment about 1.5 m long on the ground, and the Concert Hall ridge measures 123,800 mm.
Step 3: heights, because maps have none
OpenStreetMap has no roof heights for the shells, and published figures disagree. I found podium heights of 12 m and 19 m, and a top of 60, 65 or 67 m depending on the source. Rather than guess, I used a LiDAR scan: the NSW Spatial Services point cloud of the area, with 45 million points in GDA2020 / MGA zone 56 coordinates and heights in metres above the Australian Height Datum.
I cropped it to about one million points in a 280 × 320 m box around the building and rotated it by 0.99°. That small angle is the difference between grid north in the map projection and true north at that spot, and without it, the scan sat visibly twisted against the OpenStreetMap outline. After the rotation, the two matched to within 1 m. The LiDAR points that are classified as building gave these heights:
| Where | Height above datum |
|---|---|
| Top of the Concert Hall shells | 67.7 m |
| Top of the Joan Sutherland Theatre shells | 61.1 m |
| Podium deck | about 13.0 m |
| Forecourt | about 3.5 m |
The 67.7 m matches the 67 m most often quoted for the top of the building.
Step 4: fitting the spheres
My first attempt was the obvious one. I split the roof points into smooth patches, then fitted each patch with a sphere of whatever radius suited it best. It failed. Fourteen patches gave fourteen radii, from 55 m to 110 m. A small patch of a gently curved surface is a poor judge of curvature: lots of different spheres pass within a few centimetres of it, and a few stray points (an edge, a vent, the strip between two shells) tip the answer one way or the other.
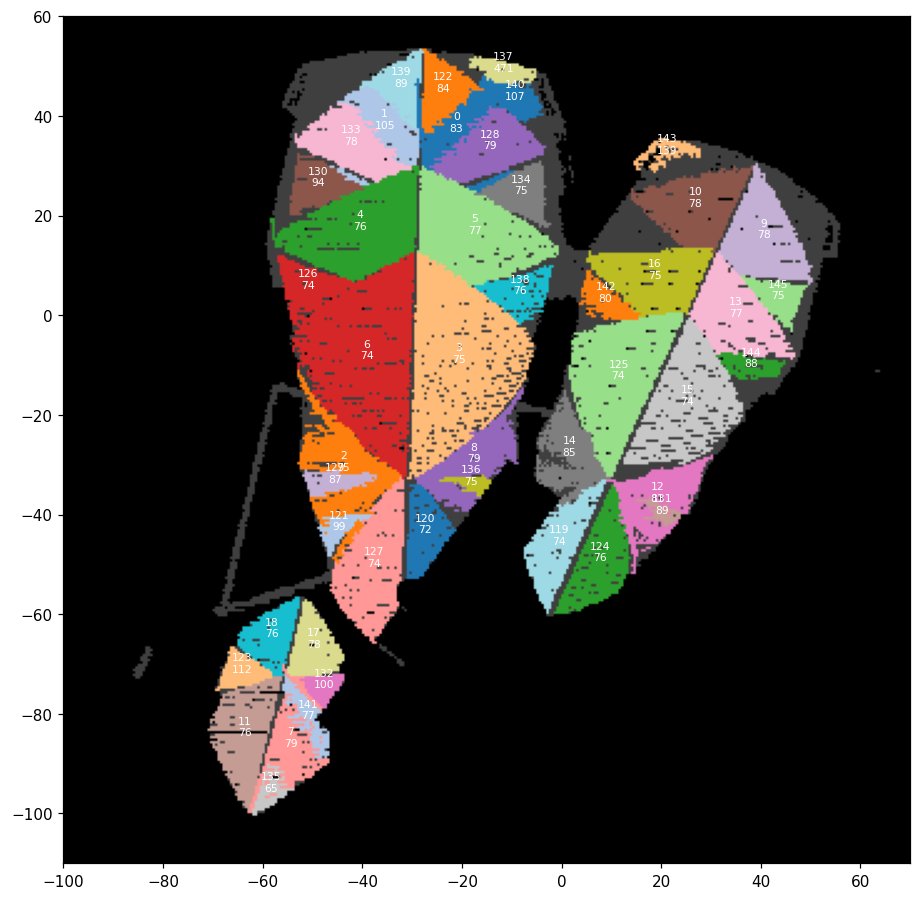
So I turned the question round. I fixed the radius at the 75.2 m given in published descriptions of the design, fitted only each sphere's centre, and grew each patch outward over every point (on a 0.5 m grid) that sat within 0.25 m of its sphere. Then, as the actual test, I let the radius go free again on the grown patches, which were now big enough to constrain it:
- The two largest patches (about 2,500 grid cells each, the main shells of the Concert Hall that rise to 67.7 m) came out at 75.17 m and 74.47 m, with the points sitting 0.12 m from the sphere on average (RMS).
- The other patches of more than 1,000 cells landed between 73.9 and 76.6 m.
- Small patches still scattered, for the same reason as before: too little curved surface to pin the radius down. Those of 200 to 500 cells came out anywhere from 72 m to 112 m, and the handful under 200 cells from 65 m to 471 m.
In the end, 98 of the 116 roof faces in the map sat on a 75.2 m sphere: one of the fitted ones, its mirror image across the hall's ridge, or one fitted to that face alone. For a building finished in 1973, the two biggest shells landing within 1% of the design radius, with about 12 cm of scatter, is a convincing yes: the shells really are pieces of one sphere.
Why one sphere mattered
A free-form roof would have needed every rib and every panel to be made to its own shape. On a sphere, every point has the same curvature, so a rib can be built from standard sections that only differ in length, and the tiles can be laid in identical panels. Published figures put it at 2,194 precast rib sections and 1,056,006 tiles. In my model, the ribs come out as lines of longitude running from a pole at the foot of each shell, and the chevron tile pattern follows them.
There is a practical lesson for anyone modelling from scans: decide what the design rule is (here, one radius), fit to that rule, and use the free fit as the check instead of the answer.
Doing this kind of trace in FlatCad
The 2D part needs nothing but FlatCad and a top-down image:
Open the image. Open a PNG or JPG and it goes under the drawing as a trace image. In the Trace image card, lower its opacity, then scale it from two points a known distance apart (a dimension you know, or the scale bar of a map export) and move it into place.
Work in real units. For a building, draw at 1:1 in millimetres (as in the screenshot above) or metres. Dimensions and exports then come out at full size.
Trace with lines and three-point arcs. Click the two ends and a point on the curve. Snaps to endpoints and intersections keep neighbouring shells joined, with no tiny gaps.
Draw half, then Mirror. Draw the ridge line first and mirror across it. Use a window that only catches the half you drew.
Use layers for each hall, or for shells, ridges and the podium, so you can export them separately as DXF or SVG for Blender or a laser.
If you want to try the sphere trick itself in FlatCad 3D, build a desk model at 1:1000. A Sphere of Ø150.4 mm is the 75.2 m sphere. Extrude a shell's outline taller than the sphere and set it to Overlap, which keeps only the part of the sphere above that outline. Then cut a Ø148.4 mm sphere at the same centre, to leave a shell 1 mm thick. At that scale the Concert Hall is about 124 mm long, which fits on most printers' beds. To get the sphere's centre for each shell, you need height data like mine; with a guessed centre, you still get a plausible-looking shell, just not the one in Sydney.
Credits: outlines © OpenStreetMap contributors; aerial imagery and LiDAR © Spatial Services NSW (LiDAR under CC BY 4.0). Drawing floor plans rather than landmarks? See drawing a floor plan to scale.
Questions
Where can I get outlines and heights for a building like this?
Footprints and roof parts often come from OpenStreetMap, which is free to use with credit. In New South Wales, true-ortho aerial photos and LiDAR point clouds come from Spatial Services NSW; LiDAR is ordered through the ELVIS portal. Other countries and states have their own elevation portals.
Why not trace from Google Maps?
Its satellite view is not a true orthophoto. Tall parts of a building lean away from their footprint, so the Opera House shells sit metres off where they actually meet the podium. An ortho photo lines up with the map.
Can FlatCad 3D model the shells?
It can model a simple version: a sphere of the right radius kept only where it overlaps an extruded outline (the Overlap operation), with a slightly smaller sphere cut away for thickness. My film's shells were built in Blender from the fitted spheres.